
🧾 Earnings: Q1 2023
A round up of Cannabis earnings from MSOs/SSOs and Cannabis Technology companies
Updated 6/1/23 for Q1 2023 Results for StateHouse, Vibe, Red White & Bloom, POSaBIT, C21 Investments.
🌿 MSOs/SSOs
Curaleaf — Q1 2023 Results

Revenue of $336.5M, up 14% year-over-year; Gross profit of $160.8M (48% GM)
Adjusted EBITDA of $73.2M
Operating cash flow from continuing operations of $30.6M
As of March 31, 2023, the Company had $115.8M of cash and $593.8M of outstanding debt, net of unamortized debt discounts
Curaleaf — Q4 and Fiscal Year End 2022 Results

Net Revenue of $352.5 million, a 14% increase year-over-year, and 4% increase quarter-over-quarter
Gross profit of $78.1 million and gross margin of 22%
Adjusted gross profit net of add-backs of $165.4 million, adjusted gross margin of 47% inclusive of a 240 basis point impact from an expense reclassification into cost of goods sold
Net loss attributable to Curaleaf Holdings, Inc. of $260.3 million or net loss per share $0.36
Adjusted net loss attributable to Curaleaf Holdings, Inc.(1) of $162 million or net loss per share(1) of $0.23
Adjusted EBITDA of $73M or 21% of revenue, excluding non-cash goodwill impairments and inventory write-downs totaling $225 million
Cash position at quarter end totaled $163M
GTI — Q1 2023 Results

Revenue increased 2% year-over-year to $249M
GAAP net income of $9M or $0.04 per basic and diluted share
Adjusted EBITDA was $76M or 31% of revenue
Cash flow from operations of $75 million
Cash at quarter end totaled $185 million
Trulieve — Q1 2023 Results

Revenue of $289M; Gross Profit of $150M (52% GM); SG&A expenses lowered by $24M sequentially to $102M; Net loss of ($64M), adjusted net loss of ($21M) excludes non-recurring charges, asset impairments, disposals and discontinued operations. Adjusted EBITDA of $78M (27% margin)
Cash at quarter end of $195M
Exited the quarter with operations in 11 states, with 32% of retail locations outside of the state of Florida
Pledged an additional $8M to the Smart & Safe Florida ballot initiative, bringing its total contributions to $38.5M (thanks to Hirsh Jain for pointing out)
Verano — Q1 2023 Financial Results

Revenue of $227M increased 12% Y/Y and increased 1% Q/Q; Gross profit of $109M (48% GM); SG&A expense of $75M (33% of revenue); Net loss of $(9M); Adjusted EBITDA of $71M (31% margin)
Cash Flow from Operations of $17M; CapEx of $9M; Free Cash Flow of $8M
As of March 31, 2023, cash of $95M and total debt of $415M
2023 Guidance: $50-75M Free Cash Flow and CapEx of $35-50M
Cresco Labs — Q1 2023 Results

$194M Revenue, down 3% sequentially; Adjusted gross profit of $89M (46% GM)
Retail transactions of 1.2 million, a 4% increase Y/Y; Surpassed $1B in online retail sales solely through the Company’s ecommerce platform, Sunnyside.shop
Adjusted EBITDA of $29M (15% margin)
Generated positive operating cash flow of $3M, inclusive of making $32M of tax payments in the quarter
As of March 31, 2023, cash, cash equivalents and restricted cash of $90M. Senior secured term loan debt, net of discount and issuance costs, of $382M
AWH — Q1 2023 Financial Highlights

Gross Revenue increased 39.5% Y/Y and 4.9% Q/Q to $141.2M; Net revenue, which excludes intercompany sale of wholesale products, increased 34.2% Y/Y and 1.9% Q/Q to $114.2M
Net loss of ($18.5M), represented an improvement compared to a net loss of ($27.8M) in Q1 2022 and ($15.1M) in Q4 2022
Adjusted EBITDA was $23.3M (20.4% margin).
As of March 31, 2023, cash of $73.3 million, and net debt was $250.8M
Columbia Care — Q1 2023
Top 5 Markets (listed alphabetically) by Revenue in Q1: Colorado, New Jersey, Ohio, Pennsylvania, Virginia
Top 5 Markets by Adjusted EBITDA in Q1[3]: Maryland, New Jersey, Ohio, Pennsylvania, Virginia
Ended the quarter with $40.2 million in cash
Status of Pending Cresco Labs Transaction: no updates to provide on the timing for execution of agreements relating to outstanding divestiture transactions
AYR Wellness — Q1 2023

Excluding Discontinued Operations, Revenue up 18% Y/Y to $117.7 Million, up 3% sequentially
Excluding Discontinued Operations, Adjusted EBITDA up 64% Y/Y to $26.3 Million, up 9% sequentially (GAAP loss from operations was $21.7 Million, compared to $21.0 Million in Q1/22)
Cash of $96.5 Million; Debts payable (current) of $40.0 Million, Debts payable (non-current) of $140.4 Million, and Senior Secured Notes of $244.5 Million
TerrAscend — Q1 2023

Net Revenue was $69.4 million, an increase of 0.6% sequentially and 42.8% year-over-year.
Gross Profit Margin was 48.8%, compared to 44.6% in Q4 2022 and 32.1% in Q1 2022.
Adjusted Gross Profit Margin1 was 49.0%, compared to 45.3% in Q4 2022 and 40.3% in Q1 2022.
GAAP Net loss from continuing operations was $19.2 million, compared to $2.0 million in Q4 2022 and $13.8 million in Q1 2022.
EBITDA from continuing operations1 was $6.1 million, compared to $30.0 million in Q4 2022 and $1.1 million in Q1 2022.
Adjusted EBITDA from continuing operations1 was $12.2 million, compared to $12.2 million in Q4 2022 and $4.9 million in Q1 2022.
Adjusted EBITDA Margin from continuing operations1 was 17.6%, compared to 17.7% in Q4 2022 and 10.1% in Q1 2022.
Cashflow provided by (used in) continuing operations was $8.4 million compared to $7.3 million in Q4 2022 and ($18.8) million in Q1 2022.
Free cash flow was a positive $5.9 million compared to ($6.9) million in Q4 2022 and ($23.0) million in Q1 2022.
Cash and Cash Equivalents totaled $32.9 million as of March 31, 2023 as compared to $26.2 million as of December 31, 2022.
Jushi Holdings — Q1 2023 Results
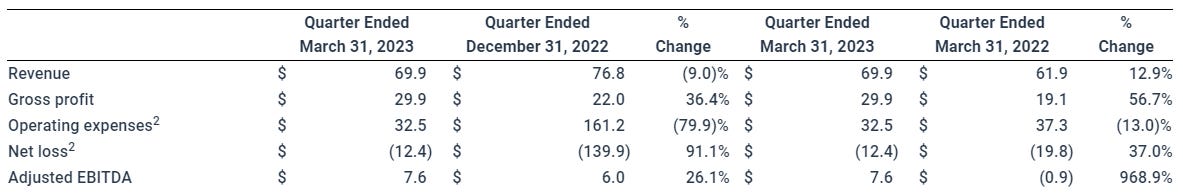
Total revenue of $69.9 million, an increase of 12.9% year-over-year
Gross profit margin was 42.9% of revenue, compared to 30.9% in Q1 2022 and 28.6% in Q4 2022
Net loss of ($12.4 million), an improvement of $7.3 million year-over-year
Adjusted EBITDA of $7.6 million, an improvement of $8.5 million year-over-year and $1.6 million sequentially
Cash, cash equivalents, and restricted cash of $19.4 million; closed $20.0 million non-dilutive debt financing with FVCbank in April 2023
As of March 31, 2023, $209.0 million in principal amount of total debt, excluding leases and property, plant, and equipment financing obligations
Acreage — Q1 2023 Financial Results

Consolidated revenue of $56.0M; Gross margin was 48%, an increase from 35% in Q4 2022. Excluding the impact of non-cash inventory adjustments, GM was 51%
Adjusted EBITDA was $10.6M (19% margin)
Ended quarter with $14.3M in cash and cash equivalents. As of March 31, 2023, $125.0M was drawn under the Amended Credit Facility, with a further $15.0M of long-term debt available from its committed debt facilities, but such funds are restricted for use to only eligible capital expenditures. Additionally, in April 2023, the Company sold, with recourse, the rights to receive certain Employee Retention Tax Credits with an aggregate receivable value of $14.3M for $12.1M
TILT Holdings — Q1 2023 Results
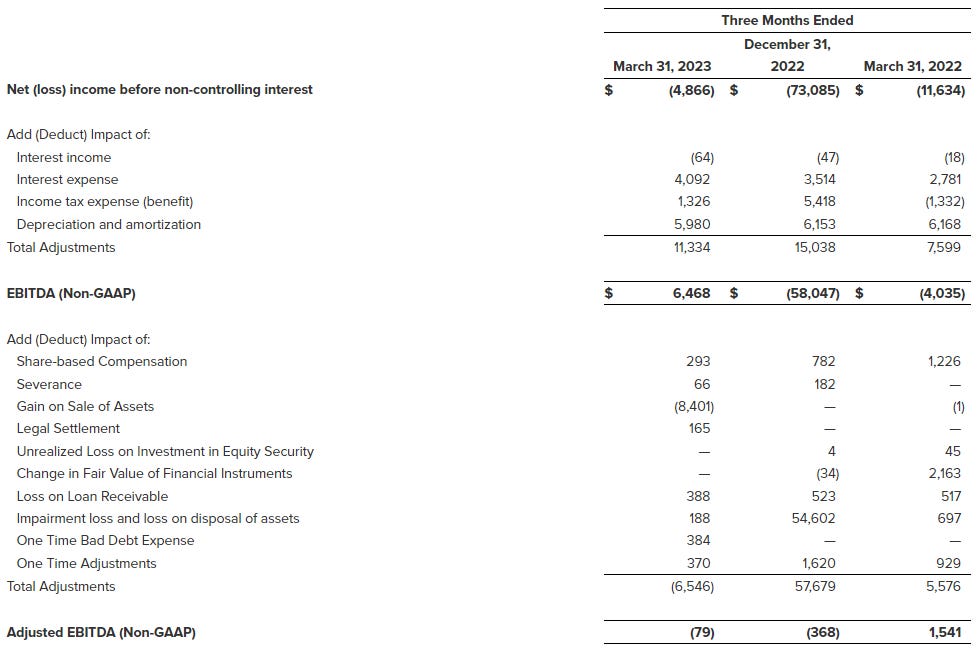
Revenue was $42.3 million compared to $42.4 million in the prior year period
Gross profit was $8.8 million (~20.8% of revenue), compared to $9.4 million (~22.1% of revenue) in the prior year period. The decrease in gross profit and gross margin was primarily due to price compression in the Massachusetts cannabis market, partially offset by an increase in gross profit and margin in the Company’s inhalation business driven primarily by lower costs of goods.
Net loss improved to ($4.9 million), compared to a net loss of ($11.6 million) in the prior year period. The improvement was primarily driven by an $8.4 million gain from the previously announced sale leaseback transaction for the Company’s Pennsylvania cultivation and manufacturing facility.
Adjusted EBITDA (non-GAAP) was $(79) thousand in the three months ended March 31, 2023, compared to $1.5 million in the prior year period. The decrease was driven by lower gross profit, higher general and administrative expenses, and increased retail headcount in Massachusetts.
At March 31, 2023, the Company had $5.2 million of cash, cash equivalents and restricted cash compared to $3.5 million at December 31, 2022. Total net debt at March 31, 2023 was $48.9 million compared to $59.7 million at December 31, 2022
Schwazze — Q1 2023 Results
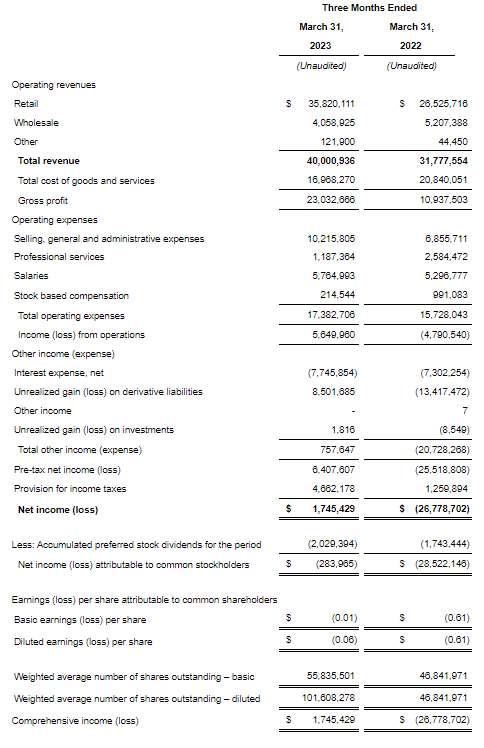
Revenues of $40.0M, an increase of 26% compared to $31.8M in Q1 2022
Gross Profit of $23.0M, an increase of 111% compared to $10.9M in Q1 2022
Operating Income of $5.6M, an increase of $10.4M compared to ($4.8M) in Q1 2022
Adjusted EBITDA (1) of $14.5M was 36.3% of revenue, compared to $7.9M and 24.7% of revenue for Q1 2022
Net Income of $1.7M, an increase of $28.5M compared to net loss of ($26.8M) in Q1 2022
Free Cash Flow (2) of $2.7M, a decrease of $3.0M compared to $5.7M in Q1 2022
Retail sales of $35.8M, an increase of 35% compared to $26.5M in Q1 2022
MariMed — Q1 2023 Earnings

Cash of $21.6M, Guidance: Revenue of at least $150M; Gross margin of ~48%; Adjusted EBITDA of at least $35M; CapEx of $30M.
Glass House Brands — Q1 2023 Results

Net Sales of $29.0 million increased 108% from $14.0 million in Q1 2022 and down 10% sequentially from $32.2 million in Q4 2022
Gross Profit was $12.0 million compared to $2.3 million in Q1 2022 and $10.2 million in Q4 2022
Gross Margin was 41%, compared to 17% in Q1 2022 and gross margin of 32% in Q4 2022
Adjusted EBITDA was $(0.1) million, compared to $(6.4) million in Q1 2022 and $(2.6) million in Q4 2022
Cost per Equivalent Dry Pound of Production was $196 a decrease of 18% compared to the same period last year and up 54% sequentially versus Q4 2022, which was expected due to seasonality
Equivalent Dry Pound Production was 48,099 pounds, up 188% year-over-year and down 36% sequentially, which was expected due to seasonality
Cash balance was $16.4 million at quarter-end, up 16% from Q4 2022 quarter end
Guidance:
2023 Cash Flow and EBITDA: With the improved wholesale pricing which GHB maintains for the balance of the year, expects to have positive operating cashflow and positive adjusted EBITDA in Q2 and for each quarter the rest of the year.
Q2 2023 Outlook: Expect revenue to be between $38 million and $40 million; expect consolidated gross margin percent to be in the mid-40s; Adjusted EBITDA to exceed $5 million and operating cash flow to be similar to Q1 at ~$4 million
2023 Fiscal Year: Maintaining revenue guidance of $160 million for 2023 but are shifting sales between segments. As a result of the higher pricing in biomass wholesale, we are increasing our wholesale revenue projection to $100 million from $85 million. We are raising our projected average selling price per pound to $330 from $300 and expect it to increase from Q1 through the remainder of the year as the mix of flower produced during the year increases. We are reducing our CPG revenue guidance to $20 million from $25 million which takes into account our move to a direct distribution model to our owned stores, and results in a reduction in top line revenue as we previously sold CPG to our distributor who then sold to our stores. It also reflects the continued difficult retail landscape and our expectation that we will be dealing with significant retailer distress and high levels of account shipping holds during the year. In addition, we are reducing our retail revenue guidance to $40 million from $50 million because of the extremely competitive marketplace, heavy discounting and our new stores not meeting internal projections.
Planet 13 — Q1 2023 Financial Results

Revenue of $24.9 million, compared to $24.8 million in Q4 2022
Net loss of ($6.3 million)
Adjusted EBITDA of $0.68 million
Cash of $42.7 million
Red White & Bloom Q1 2023 Results

Revenues were $27.0M; Gross profit, before fair value adjustments, was $9.4M;
Operating expenses were $10.9M; Adjusted EBITDA was 100K
StateHouse Q1 2023 Results
Net revenues were $24.7M, up 42.8% compared with $17.3M in Q1 2022
Retail revenues were $14.4M, representing 58.5% of total sales for Q1 2023, an increase of $2.8M compared to Q1 2022
Consolidated gross margins improved to 44.3%, compared to 31.9% for Q1 2022
During Q1, the Company reduced operating expenses from the prior quarter by ~$12.0 annualized. These reductions have been achieved through process improvements, outsourcing of distribution, upgraded and consolidated technology, and the elimination of redundant operations and service providers
StateHouse — Q4 Year-End 2022 Results
Total net revenues were $108.2 million for FY 2022, an increase of 79.4% compared with $60.3 million in FY 2021. Total net revenues for Q4 2022 increased 68.8% to $25.5 million, compared with $15.1 million in Q4 2021
Gross profit before adjustments for biological assets for FY 2022, increased 61.3% to $42.1 million compared to $26.1 million in gross profit for FY 2021. Gross profit before adjustments for biological assets for Q4 2022, increased 124% to $10.8 million, compared with $4.8 million in Q4 2021
Consolidated gross margins were 39.3% of revenues for FY 2022 and 42.4% for Q4 2022, compared to 37.1% of revenues in FY 2021 and 32.1% for Q4 2021
Retail revenues were $63.0 million, representing 58.1% of total sales for FY 2022, an increase of $24.3 million compared to FY 2021
Cansortium Q1 2023 Results

Revenue increased 12% to $22.1M compared to $19.7M
Florida revenue increased 9.7% to $18.2M compared to $16.6M
Adjusted gross profit1 increased 22% to $14.1M or 63.9% of revenue, compared to $11.5M or 58.6% of revenue
Adjusted EBITDA increased 56% to $9.7M compared to $6.2M
Cash flow from operations improved 20% to $5.1M compared to $4.3M
At March 31, 2023 the Company had ~$9.5M of cash and cash equivalents and $57.9M of total debt
Goodness Growth Holdings — Q1 2023 Results
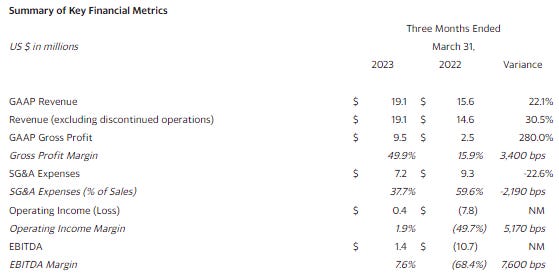
Revenue of $19.1 million increased 22.1% YoY and 30.5% excluding discontinued operations
As of March 31, 2023, cash on hand of $10.3 million, which does not include $1.7 million in net proceeds related to the Company’s recently closed convertible loan facility
The Parent Company — Q1 2023 Results
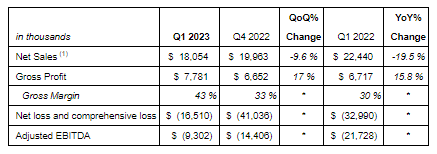
Net sales from continuing operations were $18.1 million
Gross profit from continuing operations grew 15.8% to $7.8 million, or 43% of net sales compared to $6.7 million, or 30% of net sales in Q1 2022
Q1 2023 net loss from continuing operations was ($16.5 million) compared with a Q1 2022 net loss of ($33.0 million)
Adjusted EBITDA loss from continuing operations was ($9.3 million), a 57% improvement from a loss of ($21.7 million) in Q1 2022.
Cash and cash equivalents totaled $76.1 million as of March 31, 2023
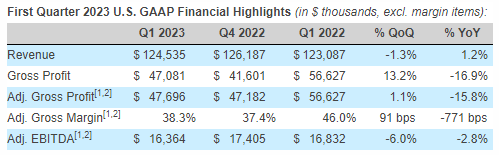
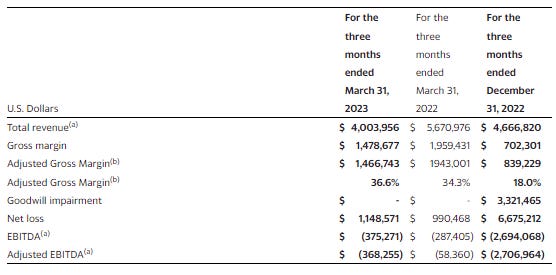
C21 Investments Unaudited Year End Results

Unaudited Fiscal Year Financial Highlights (February 1, 2022 to January 31, 2023):
Revenue of $28.9M, down 12% Y/Y (state of Nevada cannabis sales were down 16% over the comparative period)
Net Income from Continuing Operations of $1.0M; Earnings Per Share from Continuing Operations of $0.01
Gross Margin of 46.4%; Adjusted Gross Profit Margin1 of 49.0%
Adjusted EBITDA of $7.4M, 26% EBITDA Margin
Cash Flow from Operations of $6.0M
Q4 Financial Highlights (November 1, 2022 to January 31, 2023):
Revenue of $7.0M, down 2% sequentially (note - State of Nevada cannabis sales were down 3% over the comparative period)
Adjusted Gross Profit of 38%; Adjusted EBITDA of $0.9M
Cash Flow from Operations of $1.2M
Vibe Q1 2023 Results
Dispensary sales for the three months ended March 31, 2023, were $4.0M compared $5.5M in the same period in 2022. Cash position as of December 31, 2022, was $3.9M.
💻 Cannabis Technology
WM Technology — Q1 2023 Financial Results.
Revenue was $48.0M as compared to $57.5M in Q1 2022
Average monthly paying clients was 5,641 vs. 5,026 in Q1 2022
Average monthly revenue per paying client was $2,837 vs. $3,810 in Q1 2022
Net loss was ($4.0M) as compared to net loss of ($31.2M) in Q1 2022
Adjusted EBITDA was $7.1M vs $(1.0M) in Q1 2022
Basic and diluted net loss per share was $0.03
Cash of $25.9M as of March 31, 2023, with no long-term debt
Q2 2023 Guidance: Revenue is estimated to be consistent with Q1 2023, Adjusted EBITDA of ~$4M
Leafly Holdings — Q1 2023 Financial Results

Revenue was $11.2 million, down 1.5% from Q1 2022; Gross margin was 88%, improved from 87% in Q1 2022
Total operating expense was $14.9 million, down 14.7% from $17.4 million in Q1 2022, reflecting the impact of recently announced cost cutting measures
Net loss for Q1 2023 was ($5.4 million). This compares to net loss of ($19.4 million) in Q1 2022
Adjusted EBITDA loss was ($3.3 million), compared to adjusted EBITDA loss of ($5.4 million) in Q1 2022
$15M cash as of March 31, 2023
springbig — Q1 2023 Financial Highlights

Revenue increased to $7.2 million, up 16% year-on-year
Subscription revenue was up 28% year-on-year
Net dollar retention rate was 100% for the twelve months ended March 31, 2023
Gross profit was $5.8 million, representing 28% year-on-year growth and a margin of 81%
Net loss was $(2.3) million compared to a loss of $(2.9) million in the prior year
Adjusted EBITDA* loss for the quarter was $(1.3) million compared to an adjusted EBITDA loss of $(2.5) million in the same period during the prior year
Basic net income loss per share was $(0.08)
Cash and cash equivalents totaled $2.6 million as of March 31, 2023
POSaBIT Q1 2023 Financial Results
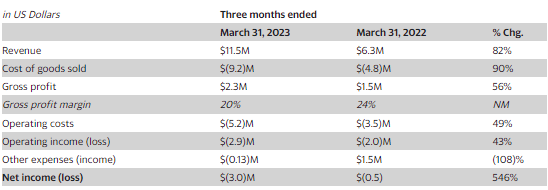
Transactional sales for payment services totaled $136M, up 33% compared with $102.5M in Q1 2022, and down (5)% compared with $143.5M in Q4 2022
Total revenue was $11.5M, up 82% compared with $6.3M in Q1 2022
Gross profit was $2.3M, or 20% of revenue, up 56% on a dollar basis compared with $1.5M, or 24% of revenue, in Q1 2022
Operating loss was $(2.9M), inclusive of a $0.3M non-cash change in the fair value of foreign currencies, compared with an operating loss of $(2.0M), inclusive of a $(0.3) non-cash change in the fair value of foreign currencies, in Q1 2022
Net loss was $(3.0M), inclusive of a $0.1M non-cash change in fair value of derivative liabilities, compared with a net loss of $(0.5M), inclusive of a $1.6M non-cash change in fair value of derivative liabilities in Q1 2022
Adjusted EBITDA was $(1.9M), or (17)% of revenue, compared with $(1M), or (20)% of revenue, in Q1 2022
Ispire Technology — FY Q3 2023 Results
Revenue increased 26.9% to $24.1 million as compared to $19.0 million in Q1 2022. Tobacco vaping products contributed $16.5 million and cannabis vaping products contributed $7.6 million to revenue
Gross profit increased 51.9% to $4.5 million as compared to $3.0 in Q3 2022
Gross margin increased to 18.7% as compared to 15.7% in Q3 2022
Total operating expenses increased 106.2% to $8.0 million as compared to $3.9 million in Q3 2022
Net loss of ($3.1 million) as compared to net loss of ($1.0 million) in Q3 2022
As of March 31, 2023, and prior to the closing of its initial public offering, Ispire had cash and cash equivalents of $24.0 million and working capital of $5.2 million.
In April 2023, Ispire closed its IPO of 3,105,000 shares of common stock, which included the 405,000 shares issued pursuant to the full exercise by the underwriters of their overallotment option, at the IPO of $7.00 per share. Gross proceeds from the offering were approximately $21.7 million, less underwriting discounts and non-accountable expense allowance of approximately $1.7 million, and other expenses of approximately $1.5 million, resulting in net proceeds of $18.5 million
Ispire commenced marketing cannabis vaping products in mid 2020, and revenue from cannabis vaping products was $7.6 million for Q3 2023. Revenue for cannabis vaping products for Q4 is projected at $12 million to $15 million, representing growth of 58% to 98% from Q3 2023
👋 Highly Objective is a weekly Cannabis newsletter and podcast curated by Dai Truong, who leads Cannabis Investment Banking at Arlington Capital Advisors. Third-party information presented here and links to third-party content are for informational purposes only and are not intended as a recommendation, offer or solicitation for the purchase or sale of any financial instrument, security or investment. The information provided is not warranted as to completeness or accuracy and is subject to change without notice. Linking to third-party sites in no way implies an endorsement or affiliation of any kind between Arlington Capital Advisors, LLC, or its affiliates and any third party. The information in this blog constitutes my own opinions (and any opinions posted by guest bloggers from time to time) and it should not be regarded as a description of services provided by Arlington Capital Advisors, LLC or any affiliate.
Not sure why I didn't get this post via email? Is it part of the Beverage category?